The BNK Connect dashboard has been designed with instant access and efficiency in mind. At a glance, you have core business statistics in view, with the option to dig deeper if needed.
The Dashboard is broken down into four core elements:
1. Dashboard Overview
When it comes to an effective scannability is key. To ensure that you can get an instant overview of your business, we headline the dashboard with four critical touch points:
- Unique Clients
- Revenue (in currency)
- Active Interactions
- Active Invoice
Not only do these bite-sized blocks contain real-time values, but they also include visual aids, such as a rising chart line, to show growth.

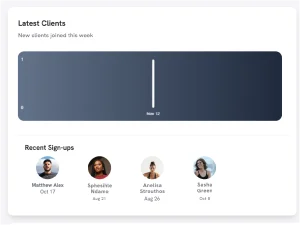
2. Latest Clients
This section of the dashboard contains a simple chart showing the number of clients, by date, who have been onboarded this week.
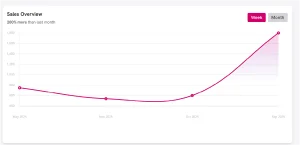
3. Sales Overview
The sales section of the dashboard contains a chart that maps your invoicing for the current month.
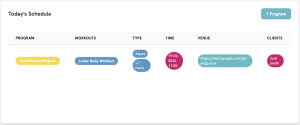
4. Today’s Schedule
This is a handy client management calendar as it shows you the training programs you have scheduled for your clients on the day. It shows the number of active Programs, the client, and the workout you have planned for them.